ROS-Readingclub
Chapter 4 Statistical Inference
February 19, 2024
INTRODUCTION
Some general remarks
ROS-book
Target:
Where is the book about?
- understanding regression models;
- applying them to real problems;
- using simulations to understand better.
Goals:
What do you have to learn?
- able to simulate regression models on the computer;
- build, evaluate and use them for applied problems;
- broad coverage (basics of statistics and measurements, linear regression, multiple regression, Bayesian inference, logistic regression, generalized linear models, extrapolation from sample to population, causal inference)
Part 1
What is the first part about?
- access to tools of mathematics, statistics, and computing that will allow to work with regression models;
- build on methods and ideas learned in an introductory statistics course.
Till now
What have you learned till now?
displaying and exploring data;
computing and graphing linear relations;
understanding basic probability models.
This chapter
About statistical inference
Statistical inference can be formulated as a set of operation on data that yield estimates and uncertainty statements about predictions and parameters of some underlying process of population.
Topics
Three main topics in this chapter
Probabilistic uncertainty statements are derived based on some assumed probability model for observed data. In this chapter:
the theme of estimation (bias and variance) in statistical inferences and statistical errors in applied work is introduced;
the theme of uncertainty in statistical inference is introduced;
the mistake to use hypothesis tests or statistical significance to attribute certainty from noisy data are discussed.
ESTIMATION
Some definitions
Estimation
Statistical inference is used to learn from incomplete or imperfect data.
in the sampling model we are for example interested in learning some characteristics of a population from a sample;
in the measurement model we are interested in learning about the underlying pattern or law;
model error refers to the inevitable imperferction of the model.
Sampling distibution
Best possible datasets
The sampling distribution is the set of possible datasets that could have been observed if the data collection process had been re-done, along with the probabilities of these possible values.
Parameters
Unknown numbers
Parameters are the unknown numbers that determine a statistical model, e.g. \(y_i=a+bx_i+\epsilon_i\) in which the errors \(\epsilon_I\) are normally distributed with mean 0 and standard deviation \(\sigma\).
Coefficients and scales
Between exacts and more rough
The parameters \(a\) and \(b\) are called coeffients and \(\sigma\) is a scale or variance parameter.
Standard error
Uncertainty about the estimate
The standard error (\(\sigma/ \sqrt{n}\)) is the estimated standard deviation of an estimate and can give us a sense of our uncertainty about the quantity of interest.
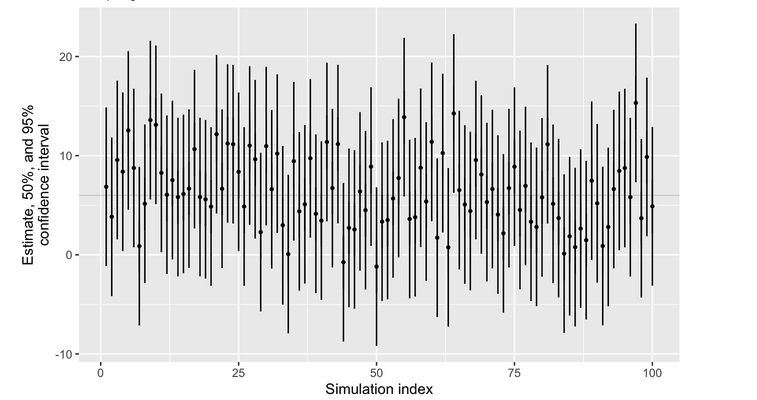
Confindence interval
Range of values
The confidence interval represents a range of values of a parameter or quantity of that are roughly consistent with the data, given the assumed sampling distribution
Practice example 1
Confidence interval
Estimation
UNCERTAINTY
Take this more seriously
Bias
Nearly always the case
- real data collection is imperfect and biased;
- where possible we should include the possibility of model error in our inferences and predictions.
Bias in estimation
Once again, nearly always the case
Roughly speaking, we say that an estimate is unbiased if it is correct on average.
Bias and sampling distribution
What is the case?
bias depends on the sampling distribution of the data, which is almost never exactly known;
random samples and randomized experiments are imperfect in reality;
any approximation become even more tenuous when applied to observational data.
Accounting for uncertainty
Three ways to do this
improve data collection;
expand the model;
increased stated uncertainty.
Key role of regression
What can we do?
adding information to a model to improve prediction should also allow us to better capture uncertainty in generatlizaton to new data;
we recognize that our inferences depend on assumptions such as representativeness and balance and accurate measurement;
it should always be possible to increase standard errors and wide interval estimates to account for additional source of uncertainty.
Practice example 2
Death penalty

Uncertainty
STATISTICAL SIGNIFICANCE
Older and new ways
Hypothesis testing
What is it?
performing data analysis is the possibility of mistakenly coming to strong conclusions that do not reflect real patterns in the underlying population;
Statistical theories of hypothesis testing and error analysis have been developed to quantify these possibilities in the context of inference and decision making.
Statistical significance
Not recommended
A commonly used decision rule that we do not recommend is to consider a result as stable or real if it is “statistically significant” and to taken “non-statistically” results to be noisy and to be treated with skepticism.
“Reject” or “not reject”
Outdated reasoning
The possible outcomes of a hypothesis test are “reject” or “not reject”;
It is never possible to “accept” a statistical hypothesis, only to find that the data are not sufficient to reject it.
Hypothesis significance testing
Not very helpful
Gelman et al. (2013) argue that hypothesis significance testing is not helpful to formulate and test null hypotheses that we know ahead of time cannot be true;
then testig null hypotheses is just a matter of data collection: with sufficient sample size, any hypothesis can be refected, and there is no real point to gathering a mountain of data just to reject a hypothesis that we did not believe in the first place.
The concept of statistical significance
Problems with it
Statistical significance is not the same as practical significance;
Non-significance is not the same as zero;
The difference between “significant” and “non-significant” is not itself statistically significant;
Statistical significance can be attained by multiple comparisons or multiple potential comparisons;
The statistical significant estimates tend to be overestimated.
Beyond hypothesis testing.
Using more information
The most important aspect of their statistical method is its ability to incorporate more information into the analysis.
How to go beyon hypothesis testing
General rules
Analyse all your data;
Present all your comparisons;
Make your data public.
But also new methods
Use of Bayesian methods
Bayesian methods can reduce now-common pattern of the researchers getting jerked around by noise patterns that happen to exceed the statistical significance threshold. We can move forward by accepting uncertainty and embracing variation.
Practice example 3
Traditional and new hypothesis testing
Hypothese testing